Decoding Your Soil Test Results
Katelyn Miller, Field Crops and Forage Specialist
Southwest New York Dairy, Livestock and Field Crops Program
Regular soil sampling is important for improving management practices, but many people feel confused when they receive their test results. With so much information, it can be hard to know what to do next. In this article, I'll explain the different measurements found in soil test reports and how to use this information effectively.
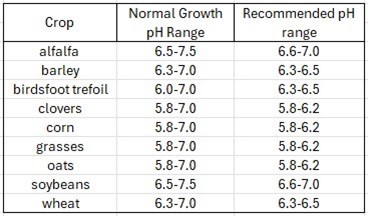
1. Soil pH: pH is a measure of active acidity and is determined by the concentration of hydrogen ions (H+) in the soil. For most crops, a pH between 6.0 and 7.0 gives the best nutrient availability. If the pH of the soil is too high or low, adding additional fertilizer will not fix any deficiencies. Along with pH, a soil's buffer pH is measured. This value refers to the ability of the soil to resist changes in pH. A good buffer pH for a given pH value is close to the desired pH.
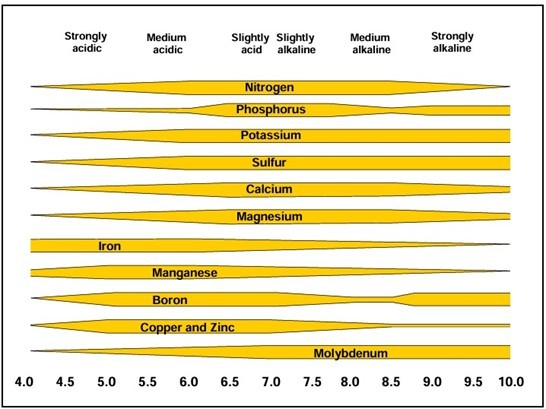
2. Lime: To correct a low pH, lime should be added. If an addition is needed, the recommendations will provide you with a value to apply in tons/acre. This value is the rate to apply for a product that has 100% ENV (Effective Neutralizing Value). This value represents the fineness of the material. All reputable lime that you purchase will have the ENV value on its label. If the value of the lime you purchased is not 100%, you can calculate your lime application rate with this formula:
Rate of use = recommended rate/ENV (of lime source) x 100
Here is a sample problem:
Soil test recommendation is 1.5 tons/acre of 100% ENV; the material you purchased has an ENV of 70.3%
Lime rate (tons/acre) = (1.5 / 70.3) x 100 = 2.1 tons/acre
It's important to remember that additions of lime will not result in immediate pH changes. In many circumstances, it may take as long as six months for a significant change in pH to occur.
3. Nitrogen: As you may have noticed, Nitrogen is not measured on the soil test you received. Nitrogen is not measured because it cycles too quickly between chemical forms, is sensitive to weather changes, and is prone to leaching. Recommendations are provided based on the crop you listed on the submission form. The provided value can be adjusted to account for legumes, manure applications, and organic matter contributions.
4. Major Nutrients: The macronutrients tested are Phosphorus (P), Potassium (K), Calcium (Ca), and Magnesium (Mg). The values reported are in pounds per acre and are rated as very low, low, medium, high and very high. When nutrient values fall into the optimum category and above, fertilizer additions are typically not recommended. This is determined by the crop you selected on the submission form. When nutrient values are low, recommendations are at the bottom to inform you of how much of that nutrient should be applied.
5. Minor Nutrients: The micronutrients tested include Iron (Fe), Manganese (Mn), and Zinc (Zn). These nutrients are required but are not needed in large quantities in the plant. In addition, Aluminum (Al) is tested but is not an essential nutrient for the plant. These are not rated on a scale of low, medium and high. If Mn + Fe + Al = > 150 lbs./acre, plant toxicity can result. If you have concerns about other micronutrients being deficient or present in excess, additional tests are available.
6. Organic Matter: Organic matter (OM) takes up a small percentage of the soil, but it is critical for healthy soil function. OM feed microbes, helps soil structure, improves water retention, and much more. For each percentage of OM, you can expect 10-20 pounds of plant-available nitrogen to be released during the growing season (depending on weather and temperature).
7. Fertilizer Recommendations: The fertilizer recommendations listed at the bottom of the report are generated by the Cornell Recommendations Engine. The recommendations are listed in pounds per nutrient, not pounds of fertilizer. Calculations are needed to determine the pounds of fertilizer you need to apply to meet the nutrient needs. A basic formula to calculate how much fertilizer you may need is:
Pounds of fertilizer = pounds of nutrient needed / percent nutrient in the fertilizer
Here is a sample problem:
The recommendation is to apply 80 pounds of K20/acre. How much muriate of potash (0-0-62) should be applied to meet this recommendation?
80 lbs. K20 / .62% fertilizer value = 129 lbs./acre
To calculate fertilizer needs with two separate fertilizer products:
The soil results call for 80 lbs. P2O5/acre and 95 lbs. of K2O/acre. If the source of P2O5 is 0-46-0 and the source of K2O is 0-0-60, how many pounds of each product do you need to meet those nutrient needs?
P2O5:
80 lbs. needed / .46% in fertilizer = 174 pounds of fertilizer needed to apply 80 lbs. of P2O5/acre
K2O:
95 lbs. needed / .60% in fertilizer = 158 pounds of fertilizer needed to apply 95 pounds of K2O/acre
To calculate the total amount of fertilizer you would need, multiply those calculated values by the number of acres you are planning to apply the fertilizer too.
8. Comments: At the bottom of the results, comments are provided. These are important to read as they will provide more information on instructions and application timing.
This article is based on results from sending soil samples to Dairy One under Form A. Accurate results first rely on a good sample taken. Contact your local Cornell Cooperative Extension office for more information on how to properly conduct soil samples and interpret results. The numbers in front of the bolded topics correlate to a number on the sample soil results provided for easy referencing.
Sample Soil Test Results (jpg; 111KB)
Upcoming Events
Boots in the Barn: Cornell Dairy Research Updates
January 13, 2026
January 20, 2026
January 27, 2026
February 3, 2026
February 10, 2026
February 17, 2026
February 24, 2026
Join us for some or all!
Deerworm and Flukes in Small Ruminants Webinar
February 25, 2026 : Deerworm and Flukes in Small Ruminants Webinar
Dr. Mary Smith from Cornell's College of Veterinary Medicine and Dr. Rachel White from UMaine Cooperative Extension will be discussing the lifecycles, signs, prevention, and management of deerworm and liver flukes in small ruminants.
NYSDEC How to Get Certified Course
March 3, 2026 : NYSDEC How to Get Certified Course
Ellicottville, NY
NYSDEC training course in preparation to take the pesticide applicator exam.
Announcements
Cows, Crops & Critters Newsletter Sponsorship
TRYING TO REACH GROWERS AND AGRIBUSINESSES IN OUR SOUTHWEST REGION OF NEW YORK?Weekly Email Update: Shared with 625+ households who have signed up with our program.
Monthly Paper Mailer: To reach our stakeholders and farmers who lack internet access, we send out a monthly mailer where your company's logo and contact information would be featured with a mailing list of 330+ households.
If you sponsor our weekly and monthly publications you reach approximately 955 households.

